What Data Are And Are Not
The Guardian has an excellent post on what data are and are not. The post’s author, Jonathan Gray, makes several excellent points. Among them is the near axiomatic truth that conclusions are frequently rolled out by entities that don’t really understand what the underlying data are really saying.
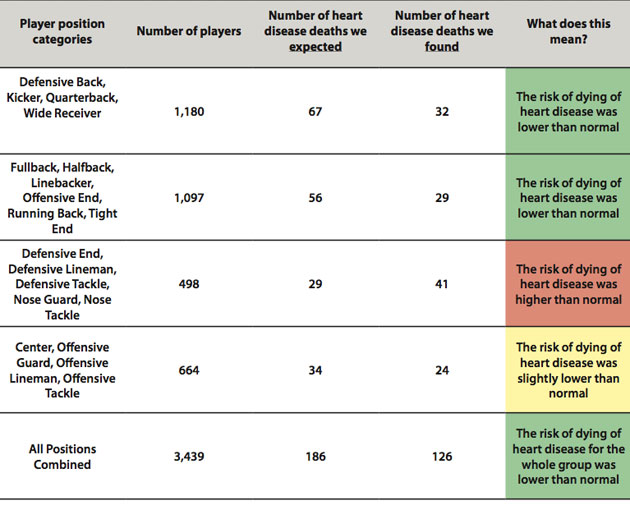
CBS Sports posted an article about NFL players and their longevity, etc., when compared to the rest of us. This is an excellent example of data analysis gone completely wrong. In a nutshell, the CBS article seems to present compelling data for greater longevity of football players as compared to the general public. Unfortunately, if you don’t have training in research methodology and/or statistics, you would have not ever known what you were really looking at. This is not uncommon, even among those of us with standard graduate-level statistics coursework. Here’s the table presented in the article linked above:

Although it’s not stated in the article, the data comparisons made were clearly performed using a Chi-square analysis, which is a type of descriptive, non-parametric statistical analysis used to analyze nominal or ordinal data and determine if there are any differences between the number of events observed and the number that were expected. The number of observations expected can be defined by the user, or can be gleaned from existing data. Descriptive analyses like Chi-square tell us something about the makeup of k groups of n size. This is in comparison to inferential statistical analyses that can help understand the “how” and “why” questions about the relationships between groups and/or associated variables. Now let’s talk a bit more about the content rather than somewhat esoteric definitions.
In this study, a Chi-square was the appropriate choice for what the researchers were looking for (i.e., differences between Us and Them); however, Chi-square should generally be used as a preliminary analysis to determine if sample sizes between groups are statistically significantly different. This information is then used to inform us as to whether groups are too different in size or makeup for other, inferential analyses. In other words, it seems that the researchers effectively stopped before they ever really got going. For the kind of question being asked here, they should have gone much, much further than a Chi-square. It’s well beyond the scope of this post to do a full critique of the study, but an analysis that yielded hazard or risk ratios through some form of regression (e.g., discriminant function analysis, Cox regression) would have been a logical next step. Click on those links for a quick read, and I think you’ll agree that the descriptions (a) sound a lot like they fit with the NFL study, and (b) seem like they go a bit deeper than merely asking “are groups A and B different?” These two analyses represent better, more detailed methods for answering such questions. The conclusions and findings offered on CBS’ blog are, unfortunately, misleading and wrong-headed.
As neuropsychologists, we have training that allows us to see data from many perspectives, each with its own path of rule-outs and possibilities. One (big) problem, though, is that the ability to convey results of a neuropsychological evaluation to our patients in a meaningful way is a hard-won skill. It is difficult sometimes, but we have to remember that our patients generally are not analytically-minded, stats-savvy, etc., individuals. They can be quickly and easily swayed (or just plain confused) by the data we deliver.
The take-home message of the Guardian’s article is to be careful when you see data presented like this. To paraphrase Jonathan Gray: just because anyone can go around and get all these great data doesn’t mean they should. Why? Because most people probably don’t have the context and training necessary to make sense of what the data are really saying, but you do! Remember this, be aware of it, and grow as a clinician.


